
Price Action Trading: A Practical Guide to Reading the Market
Price Action Trading: A Practical Guide to Reading the Market
Price action trading is a popular approach to financial market analysis that focuses primarily on the movement of price itself. Instead of depending heavily on technical indicators, price action traders study candlestick patterns, market structure, support and resistance, trends, and important price levels to understand what buyers and sellers may be doing.
The goal is not to predict every market move. Rather, traders use price behavior to identify potential opportunities while managing risk carefully.
What Is Price Action Trading?
Price action trading is the analysis of historical and current price movements to identify patterns and potential trading setups.
A trader may examine:
Candlestick formations
Higher highs and higher lows
Lower highs and lower lows
Support and resistance
Breakouts and breakdowns
Trend direction
Rejections from important levels
Consolidation and range-bound markets
Changes in buying and selling pressure
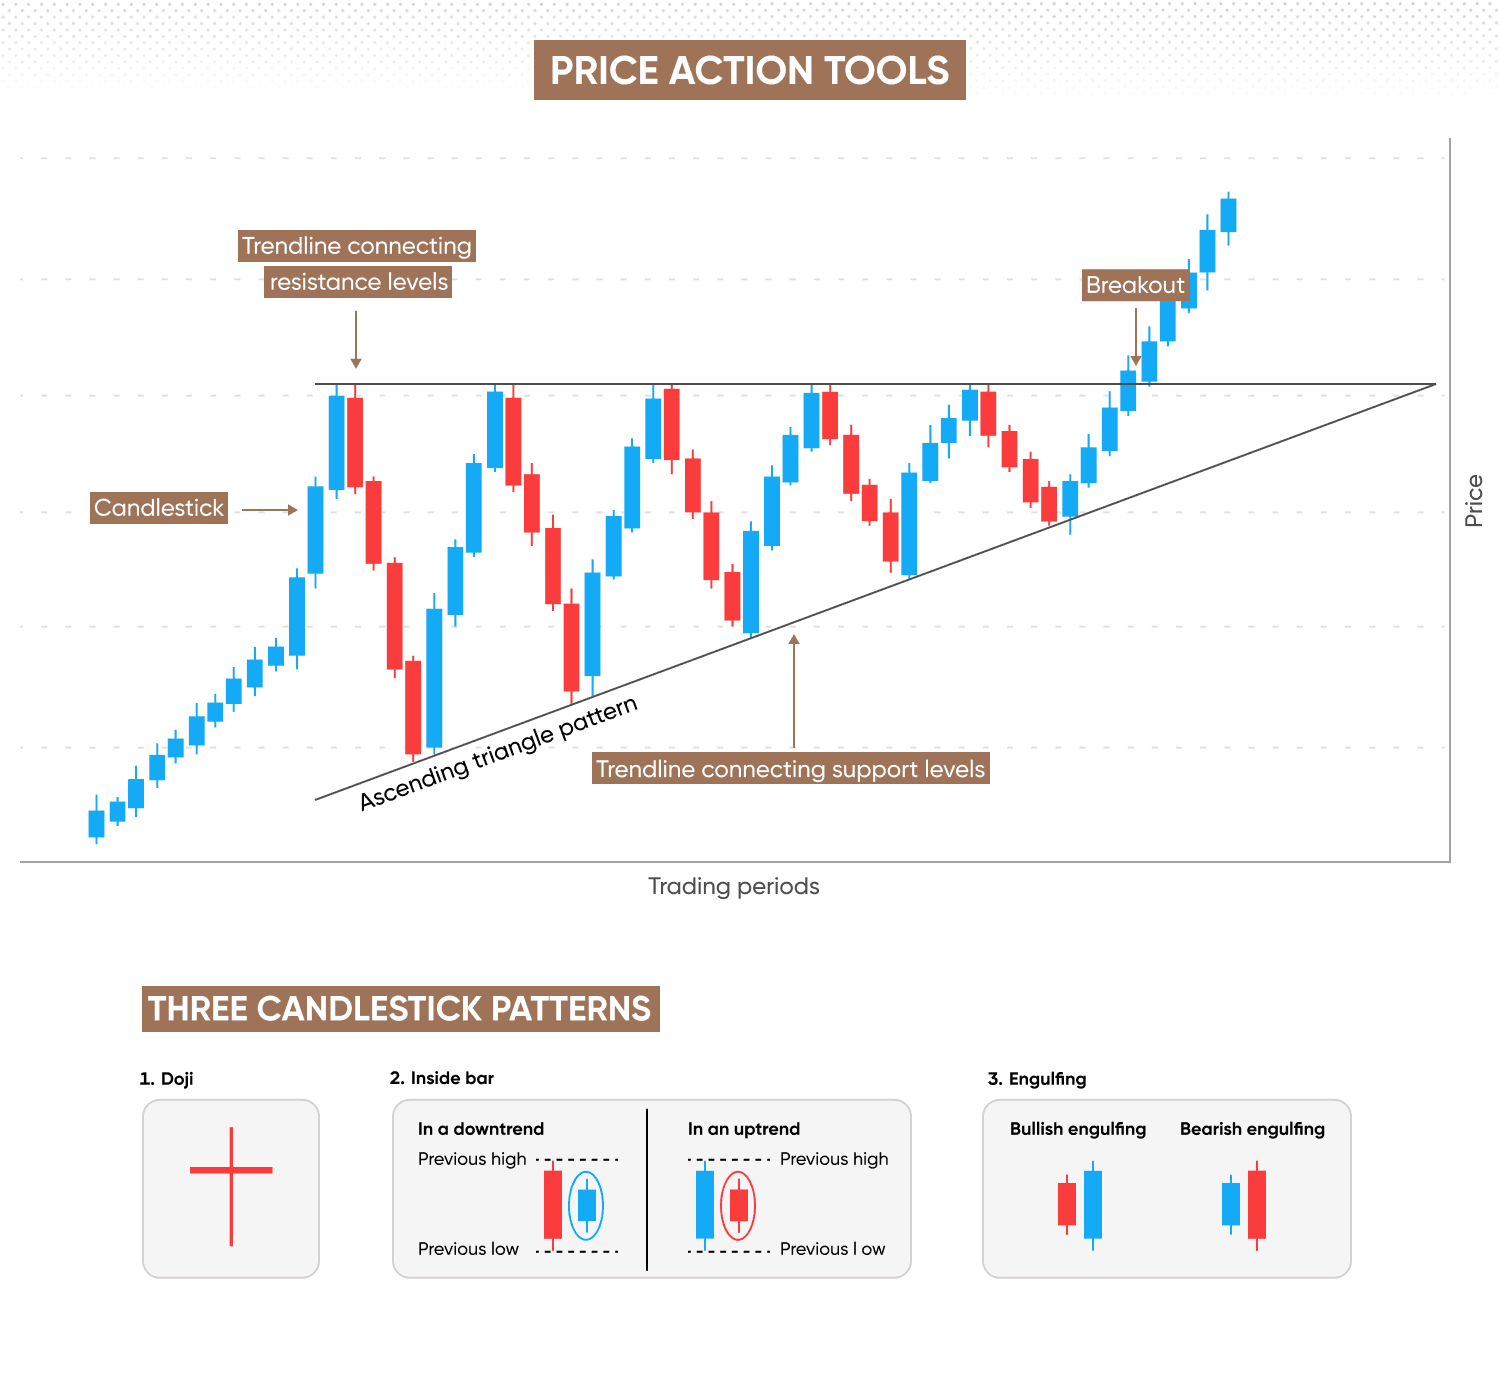
For example, when price repeatedly reaches a resistance area but struggles to move above it, a trader may watch for signs of rejection. Similarly, if price breaks through resistance with strong momentum and later retests that area, the trader may analyze the retest for a possible continuation setup.
Understanding Market Structure
Market structure is one of the foundations of price action analysis.
In an uptrend, price generally creates a sequence of:
Higher High → Higher Low → Higher High → Higher Low
In a downtrend, the structure often looks like:
Lower Low → Lower High → Lower Low → Lower High
Recognizing these sequences can help traders understand the current market environment.
However, markets do not always move smoothly. A trend can pause, consolidate, or reverse. This is why traders should avoid treating one price movement as confirmation of a complete trend change.
The Role of Support and Resistance
Support and resistance are important areas where price has previously reacted.
Support is an area where buying interest has historically appeared and price has struggled to move lower.
Resistance is an area where selling pressure has historically appeared and price has struggled to move higher.
These are better viewed as zones rather than exact lines because markets rarely respect a single price point perfectly.
A useful price action setup can occur when price reaches one of these zones and produces a recognizable reaction, such as a rejection candle or a strong reversal pattern.
Candlestick Patterns in Price Action
Candlesticks provide visual information about the relationship between opening, closing, high, and low prices during a specific period.
Some commonly studied formations include:
Pin Bar
A pin bar has a relatively small body and a prominent wick. It can indicate rejection of a price area, particularly when it forms near meaningful support or resistance.
Engulfing Candle
An engulfing pattern occurs when one candle's body substantially covers the previous candle's body. Traders sometimes use bullish and bearish engulfing formations as evidence of changing short-term momentum.
Inside Bar
An inside bar forms when the current candle's range is contained within the previous candle's range. It can represent temporary consolidation and may precede a breakout.
Candlestick patterns should not be interpreted in isolation. Their location, market structure, trend, and surrounding price behavior are important.
Breakouts and Retests
Breakouts are another important part of price action trading.
A breakout occurs when price moves beyond a significant support, resistance, or consolidation area.
For example:
Resistance → Breakout → Pullback → Retest → Potential Continuation
A retest occurs when price returns toward the level it previously broke. Some traders watch the retest for evidence that the former resistance has become support, or vice versa.
However, not every breakout succeeds. False breakouts can occur when price briefly moves beyond a level before returning to the previous range.
Trading With Trends
Many price action traders pay close attention to the broader trend.
In an uptrend, they may look for opportunities around pullbacks toward support or previous swing levels.
In a downtrend, they may watch for rallies toward resistance or previous swing highs.
This approach is based on the idea that understanding the larger market structure can provide context for shorter-term price movements.
Risk Management Is Essential
Price action analysis does not eliminate trading risk. Even a well-formed setup can fail.
Risk management may include:
Defining an entry before taking a trade
Setting a stop-loss level
Limiting the amount risked on an individual position
Considering the potential reward relative to the risk
Avoiding excessive leverage
Keeping a trading journal
Using position sizing appropriate to the account
A trading strategy should be evaluated over a meaningful number of trades rather than judged from one successful or unsuccessful setup.
Common Price Action Trading Mistakes
Beginners often make several mistakes when learning price action.
1. Trading Every Candlestick Pattern
A candlestick pattern by itself does not guarantee a market reversal or continuation. Context matters.
2. Ignoring Market Structure
A bullish candle does not automatically mean the market has entered an uptrend. Traders should consider swing highs, swing lows, and the broader trend.
3. Entering Too Quickly
Some traders enter as soon as price touches a level. Waiting for additional confirmation can help create a more clearly defined trading plan, although it cannot eliminate losses.
4. Risking Too Much
A single trade should not have the power to seriously damage a trading account. Position sizing and predefined risk limits are important parts of responsible trading.
5. Changing the Strategy Constantly
Jumping between different strategies after a few losing trades makes it difficult to determine whether a method actually works over time.
A Simple Price Action Analysis Process
A trader can organize analysis into a simple sequence:
Step 1: Identify the Market Trend
Determine whether price is generally trending upward, trending downward, or moving sideways.
Step 2: Mark Important Levels
Identify significant support, resistance, swing highs, swing lows, and consolidation zones.
Step 3: Wait for Price to Reach an Important Area
Rather than entering randomly, observe how price behaves around a predefined level.
Step 4: Analyze the Price Reaction
Look for rejection, breakout behavior, engulfing candles, or other relevant price action.
Step 5: Define Risk Before Entry
Determine the entry, stop-loss, position size, and potential exit conditions.
Step 6: Record the Trade
A trading journal can help identify recurring mistakes and determine which setups perform consistently under specific market conditions.
Price Action and Technical Indicators
Price action trading does not necessarily mean avoiding indicators completely.
Some traders combine price action with tools such as:
Moving averages
Relative Strength Index (RSI)
Average True Range (ATR)
Volume-based analysis
For example, a trader might use market structure and support/resistance to identify a setup while using ATR to help understand recent volatility.
The important principle is to use tools for a clear purpose rather than adding indicators simply because they are available.
Final Thoughts
Price action trading provides a framework for studying how markets move through the interaction of buyers and sellers. By learning market structure, support and resistance, candlestick behavior, breakouts, and risk management, traders can develop a more systematic approach to analyzing charts.
There is no price action pattern that guarantees a profitable trade. Successful trading requires disciplined execution, appropriate risk management, continuous learning, and the ability to evaluate a strategy using historical and live-market data.
Disclaimer: This article is for educational and informational purposes only. It is not financial advice or a recommendation to buy or sell any financial instrument. Trading and investing involve risk, including the possible loss of capital.
Related Topics & Tags
Related Stories
 Trading
Candlesticks and Candlestick Patterns: A Beginner’s Guide to Reading Price Action
Candlestick charts help traders understand price movements by showing the open, high, low, and close of an asset. This article explains popular candlestick patterns such as Doji, Hammer, Shooting Star, Engulfing, Morning Star, and Evening Star, along with how traders use them with market context and risk management to analyze potential trading opportunities.
