
Candlesticks and Candlestick Patterns: A Beginner’s Guide to Reading Price Action
Candlesticks and Candlestick Patterns: A Beginner’s Guide to Reading Price Action
Understanding price movement is one of the most important skills in trading. Among the many tools traders use to study markets, candlestick charts are popular because they provide a simple visual representation of price behavior during a specific period.
Candlesticks can help traders understand whether buyers or sellers were more active, identify changes in market momentum, and recognize potential trading opportunities. However, candlestick patterns should not be treated as guaranteed signals. They are most useful when combined with market context, risk management, and other forms of analysis.
What Is a Candlestick?
A candlestick represents the price movement of an asset during a selected time period. Depending on the chart timeframe, one candlestick might represent one minute, one hour, one day, or even one week.
Each candlestick contains four important prices:
Open: The price at which the period began.
High: The highest price reached during the period.
Low: The lowest price reached during the period.
Close: The price at which the period ended.
A candlestick has two main parts: the body and the wick, also known as the shadow.
The body shows the difference between the opening and closing prices. The wicks show the highest and lowest prices reached during the period.
Bullish and Bearish Candlesticks
A bullish candlestick generally means that the closing price was higher than the opening price. It suggests that buyers were able to push the price upward during that period.
A bearish candlestick occurs when the closing price is lower than the opening price. It indicates that sellers controlled more of the price movement during that period.
The exact colors used for bullish and bearish candles depend on the charting platform. Traders should focus more on the relationship between the open and close than on the colors themselves.
Why Candlesticks Matter in Trading
Candlesticks provide more information than simply showing whether a market went up or down.
For example, a candle with a long upper wick may show that buyers pushed prices higher but sellers later forced the price back down. Similarly, a long lower wick can indicate that prices moved lower before recovering.
By examining these details, traders can study price action and look for changes in buying and selling pressure.
Candlestick analysis can be useful for:
Identifying potential reversals
Studying market momentum
Recognizing periods of uncertainty
Finding possible continuation setups
Understanding price rejection around important levels
Supporting entry and exit decisions
Common Candlestick Patterns
There are many candlestick formations, but several patterns are frequently discussed by traders.
1. Doji
A Doji forms when the opening and closing prices are very close to each other.
It can indicate uncertainty or a temporary balance between buyers and sellers. A Doji by itself does not necessarily mean that a reversal will occur. Its significance depends heavily on where it appears and what happens afterward.
2. Hammer
A Hammer typically appears after a decline and has a relatively small body with a long lower wick.
The formation can indicate that sellers pushed the price lower, but buyers managed to recover much of the decline before the candle closed.
Traders often examine a Hammer near a support area for additional confirmation.
3. Shooting Star
A Shooting Star generally appears after an upward price movement. It has a small body and a relatively long upper wick.
The pattern suggests that buyers pushed prices higher, but sellers entered and forced the price back toward the opening area.
When it appears near resistance, traders may watch subsequent candles for evidence of weakening bullish momentum.
4. Engulfing Patterns
An engulfing pattern consists of two candles.
A bullish engulfing pattern occurs when a larger bullish candle follows a smaller bearish candle and its body substantially covers the previous candle's body.
A bearish engulfing pattern occurs when a larger bearish candle follows a smaller bullish candle.
Engulfing patterns are often studied as possible changes in short-term momentum, particularly when they occur near significant support or resistance levels.
5. Morning Star
The Morning Star is a multi-candle formation that can occur after a decline.
It generally consists of:
A bearish candle
A smaller candle showing reduced momentum or uncertainty
A stronger bullish candle
Traders may interpret the formation as a potential shift from selling pressure toward buying pressure.
6. Evening Star
The Evening Star is generally considered the opposite structure of the Morning Star.
It can appear after an upward movement and typically consists of:
A bullish candle
A smaller candle reflecting uncertainty
A stronger bearish candle
The formation may suggest that bullish momentum is weakening, although confirmation from subsequent price action is important.
Candlestick Patterns Need Context
One of the most common mistakes among beginners is treating a candlestick pattern as an automatic buy or sell signal.
A pattern has greater meaning when considered alongside the broader market structure.
For example, a Hammer in the middle of a random price range may provide limited information. The same formation near a well-established support level could attract more attention from traders.
Useful contextual factors include:
Trend: Is the market generally rising, falling, or moving sideways?
Support and resistance: Is the pattern forming near an important price level?
Volume: Is there increased trading activity accompanying the move?
Market structure: Are highs and lows changing in a meaningful way?
Timeframe: Does the pattern appear on a short-term or long-term chart?
Confirmation: Does subsequent price action support the pattern?
Combining Candlestick Analysis With Other Tools
Candlestick patterns are usually more effective when they are part of a broader trading strategy.
Traders may combine candlestick analysis with tools such as moving averages, trendlines, support and resistance, volume analysis, and momentum indicators.
For example, a trader might identify a bullish candlestick formation near support and then wait for additional evidence before considering a trade. This approach can help reduce the risk of acting on an isolated candle.
No technical indicator or candlestick pattern can predict market prices with certainty.
Risk Management Is Essential
Recognizing a promising candlestick pattern does not eliminate trading risk.
Markets can move unexpectedly because of economic data, company announcements, geopolitical events, changes in market sentiment, or other factors.
Effective risk management may include:
Using appropriate position sizes
Defining potential losses before entering a trade
Avoiding excessive leverage
Maintaining a clear trading plan
Diversifying when appropriate
Avoiding emotional decisions
A good trading strategy is not simply about finding profitable patterns. It is also about managing situations when the market moves against the trade.
Candlestick Patterns and Trading Psychology
Candlesticks also provide a visual representation of market psychology.
A strong bullish candle can demonstrate aggressive buying during a particular period, while a long upper wick can show that higher prices were rejected.
When traders learn to interpret these formations within their broader context, candlesticks become more than chart shapes. They become a way of studying the interaction between buyers and sellers.
Final Thoughts
Candlestick charts are a valuable tool for anyone learning technical analysis. Understanding the Open, High, Low, and Close gives traders a foundation for interpreting price movement, while studying formations such as Doji, Hammer, Shooting Star, Engulfing, Morning Star, and Evening Star can provide additional insight into market behavior.
However, candlestick patterns should never be viewed as guaranteed predictions. The strongest analysis usually comes from combining price action with market structure, important price levels, confirmation, and disciplined risk management.
Whether you trade stocks, forex, cryptocurrencies, or other financial markets, learning to read candlesticks can help you develop a deeper understanding of how prices move and how market participants respond to changing conditions.
Disclaimer: This article is for educational and informational purposes only. It does not constitute financial, investment, or trading advice. Trading involves risk, and past price behavior does not guarantee future results.
Related Topics & Tags
Related Stories
 Trading
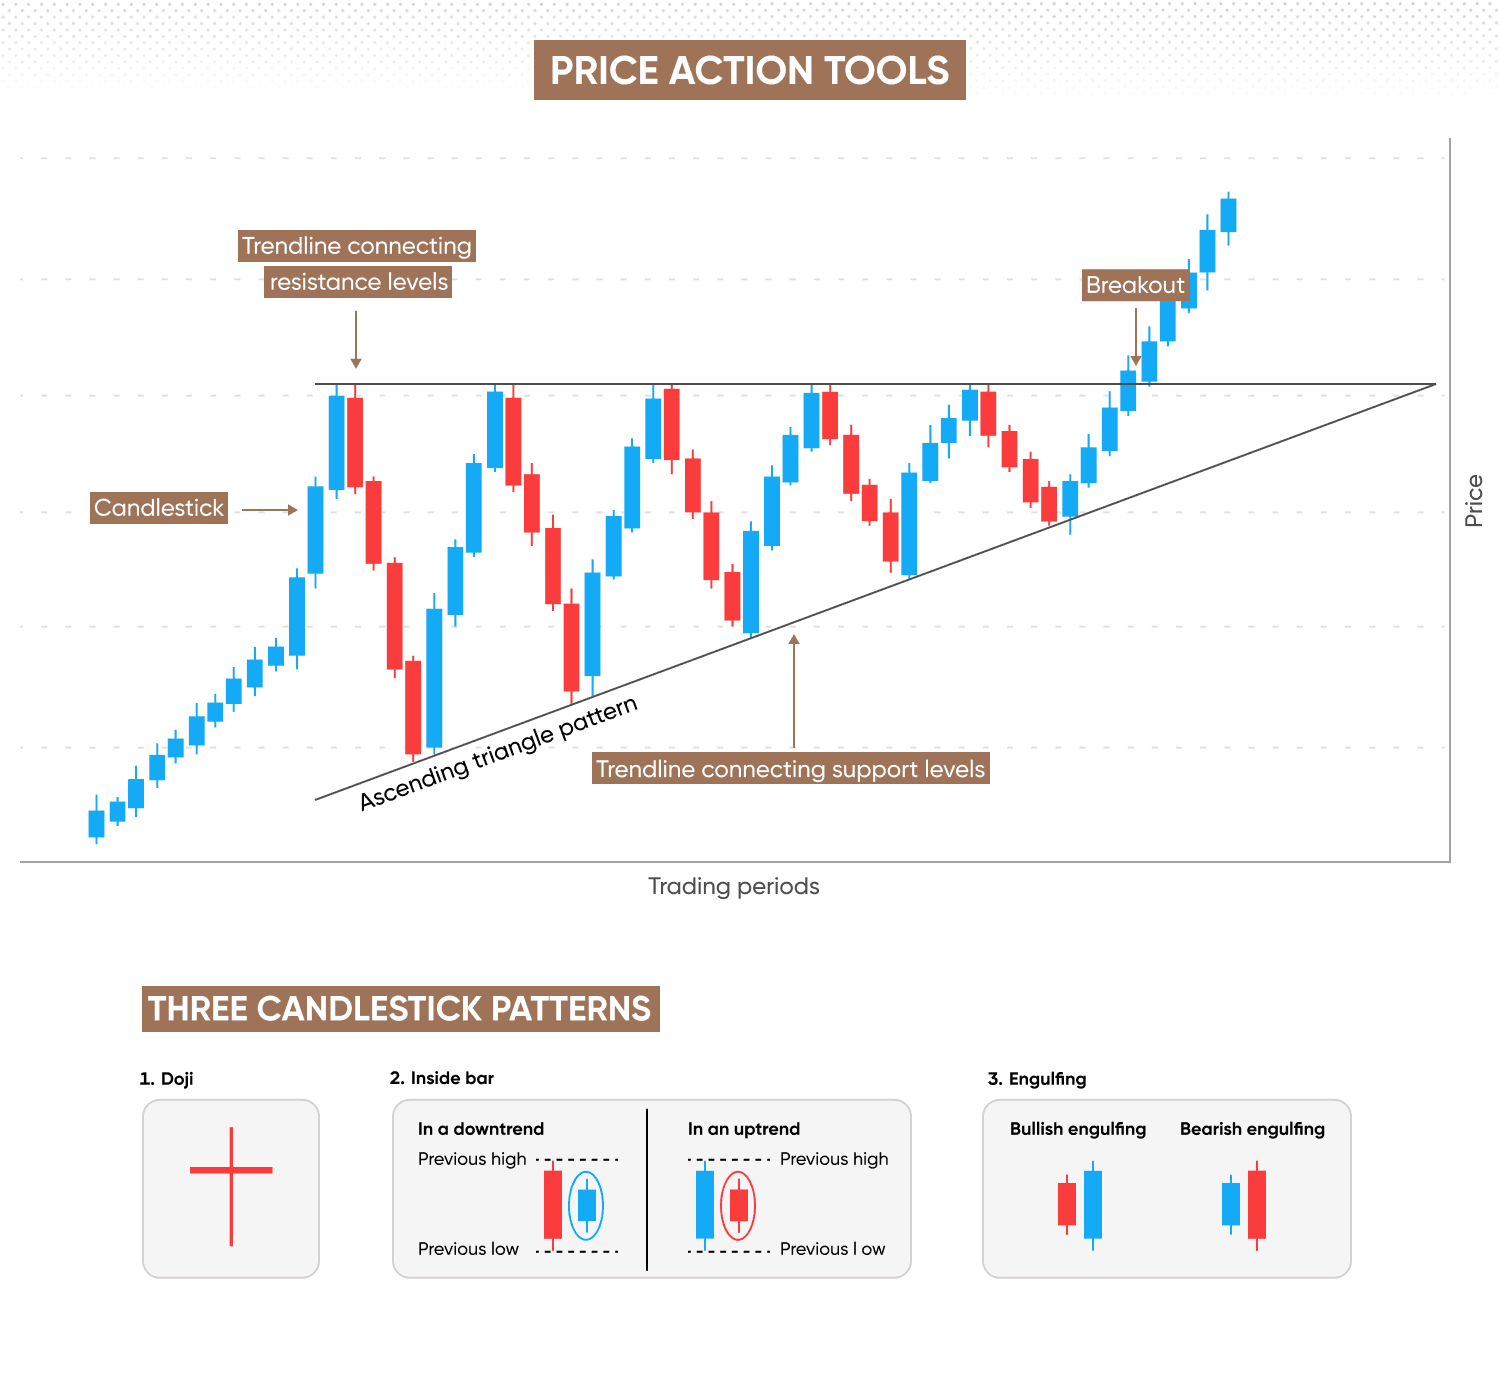
Price Action Trading: A Practical Guide to Reading the Market
Price action trading focuses on analyzing market price movements without relying heavily on technical indicators. Traders study candlestick patterns, market structure, support and resistance, breakouts, and trends to identify potential trading opportunities. Proper risk management and disciplined execution are essential because no price action setup guarantees profits.
